Parent: Azure
Azure monitor is a priceless tool for a service manager that has to ensure that all Azure services are running as they should be.
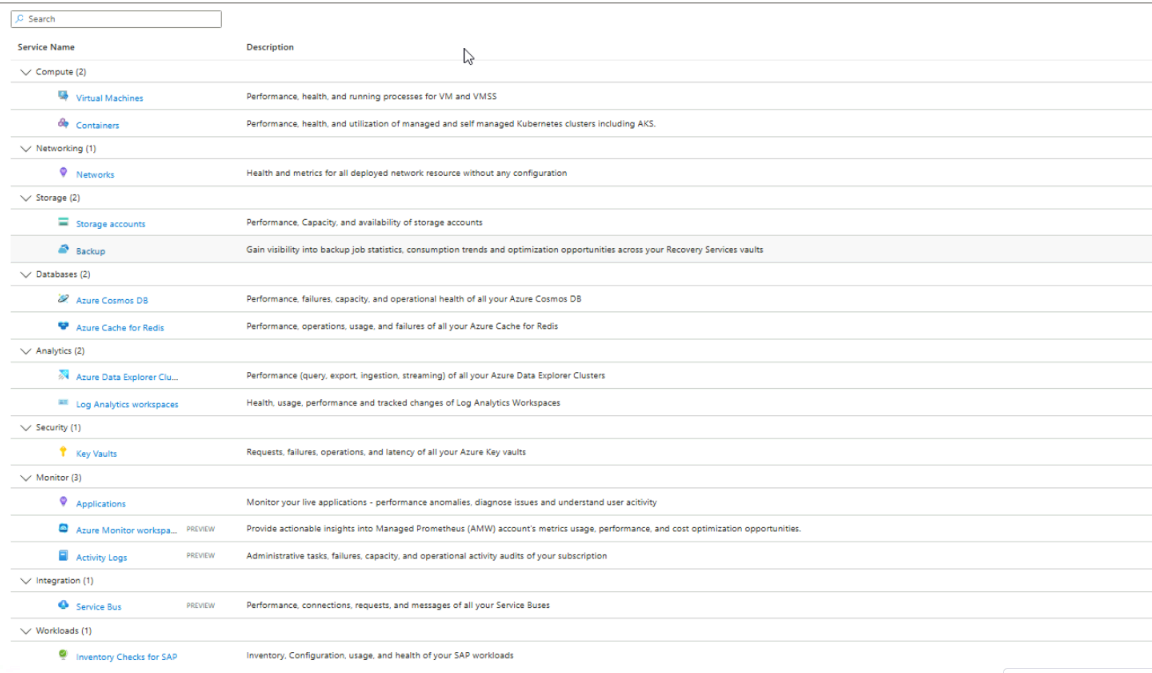
These are the services and insights that you can monitor using the Azure Monitor Service.
Data Collection
Azure monitoring can pull two types of data, Metrics and Log data. While metrics are the hardware resources that are getting consumed by the service, log data is whatever is stored in the stdout of the service. Metrics are mostly continuous while log data are mostly unstructured text
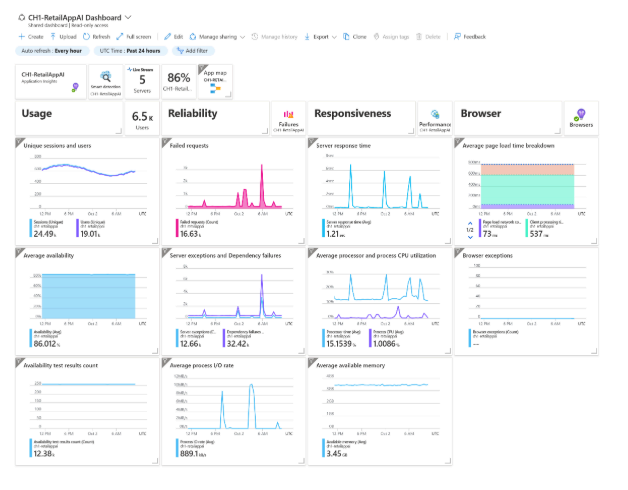
Visualize and monitor
Once you have the data collected, you can create grafana style dashboards in Azure monitor, or if you need further capabilities, you can pull the data to Power BI. You can also query the log data using “Log Analytics” which can be analysed in a spreadsheet like setting or using KQL
Proactive monitoring & alerts
But dashboards are old school now, when you have real-time data (and you do with regards to metrics), you should make the maintenance/responses automatic, which include automation and alerts.